
Obtaining a sound wave image is achievable through various methods, ranging from using audio editing software to dedicated apps and online tools. At streetsounds.net, we understand the importance of visualizing sound, whether for artistic expression, scientific analysis, or simply understanding the nuances of audio. This guide explores different approaches to capturing and creating sound wave images, offering insights and resources for enthusiasts, professionals, and anyone curious about the visual representation of sound. Dive into the world of sound visualization with us and discover how to transform audio into captivating images.
1. Understanding Sound Waves and Their Visual Representation
Sound waves are fluctuations in air pressure that our ears interpret as sound. Visualizing these waves allows us to analyze and appreciate the complex nature of audio. Let’s delve deeper into the science and art of sound wave visualization.
1.1. What is a Sound Wave?
Sound waves are longitudinal waves, meaning the particles of the medium (usually air) vibrate parallel to the direction the wave is traveling. These vibrations create areas of high pressure (compressions) and low pressure (rarefactions). The frequency of these pressure changes determines the pitch of the sound, while the amplitude determines its loudness. According to research from the Acoustical Society of America, understanding these physical properties is crucial for accurate sound wave visualization.
1.2. How Are Sound Waves Visualized?
Sound waves are typically visualized as graphs, with time on the x-axis and amplitude (or pressure) on the y-axis. This representation allows us to see the shape, frequency, and intensity of the sound. Different audio editing software and tools use various algorithms to translate audio data into visual forms.
1.3. Why Visualize Sound Waves?
Visualizing sound waves is useful for multiple reasons:
- Audio Analysis: Identifying patterns, frequencies, and anomalies in audio recordings.
- Artistic Expression: Creating visually appealing representations of sound for art installations or music visualizations.
- Education: Helping students understand the physical properties of sound.
- Diagnostics: Detecting issues in audio equipment or identifying specific sounds in noisy environments.
1.4. Common Types of Sound Wave Visualizations
Several common visualization techniques exist, each offering a unique perspective on the audio data:
- Waveform: The most common representation, showing amplitude over time.
- Spectrogram: Displays frequency content over time, providing a view of the harmonic components of a sound.
- Spectrum Analyzer: Shows the frequency spectrum at a specific point in time.
- Vectorscope: Used primarily in stereo audio analysis, showing the phase relationship between the left and right channels.
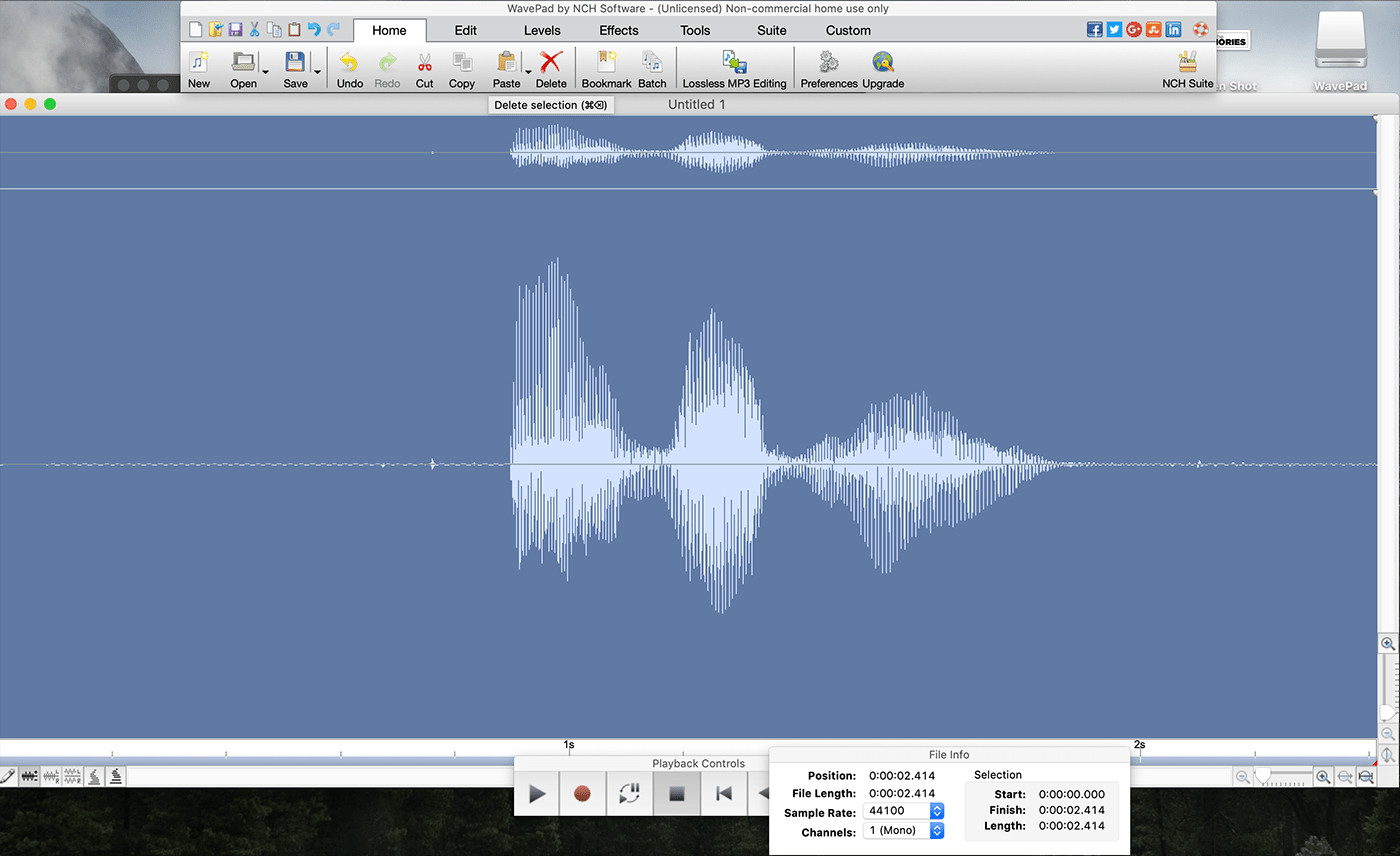 Sound wave image visualized in audio editing software
2. Using Audio Editing Software to Generate Sound Wave Images
Audio editing software offers powerful tools for recording, manipulating, and visualizing sound. These programs typically include features for generating detailed sound wave images.
2.1. Popular Audio Editing Software
Several audio editing programs are widely used for creating sound wave images:
- Audacity: A free, open-source software suitable for basic to intermediate audio editing and visualization.
- Adobe Audition: A professional-grade software with advanced features for audio editing, mixing, and mastering.
- WavePad: An accessible option for recording and editing audio, with easy-to-use visualization tools.
- Logic Pro X: Apple’s professional audio workstation, offering comprehensive audio editing and visualization capabilities.
- Ableton Live: Known for its intuitive interface and real-time audio manipulation features, making it popular for electronic music production.
2.2. Step-by-Step Guide: Creating a Sound Wave Image in Audacity
Audacity is a great option for beginners due to its accessibility and powerful features. Here’s how to create a sound wave image:
- Download and Install Audacity: Get the latest version from the official Audacity website.
- Record or Import Audio: Click the “Record” button to record new audio or go to “File” > “Import” > “Audio” to import an existing file.
- View the Waveform: Audacity automatically displays the waveform of your audio.
- Adjust the View: Use the zoom tools to adjust the waveform’s detail. You can zoom in to see individual cycles or zoom out to view the entire audio file.
- Capture the Image: Use your operating system’s screenshot tool (e.g., Snipping Tool on Windows or Cmd+Shift+4 on macOS) to capture the desired portion of the waveform.
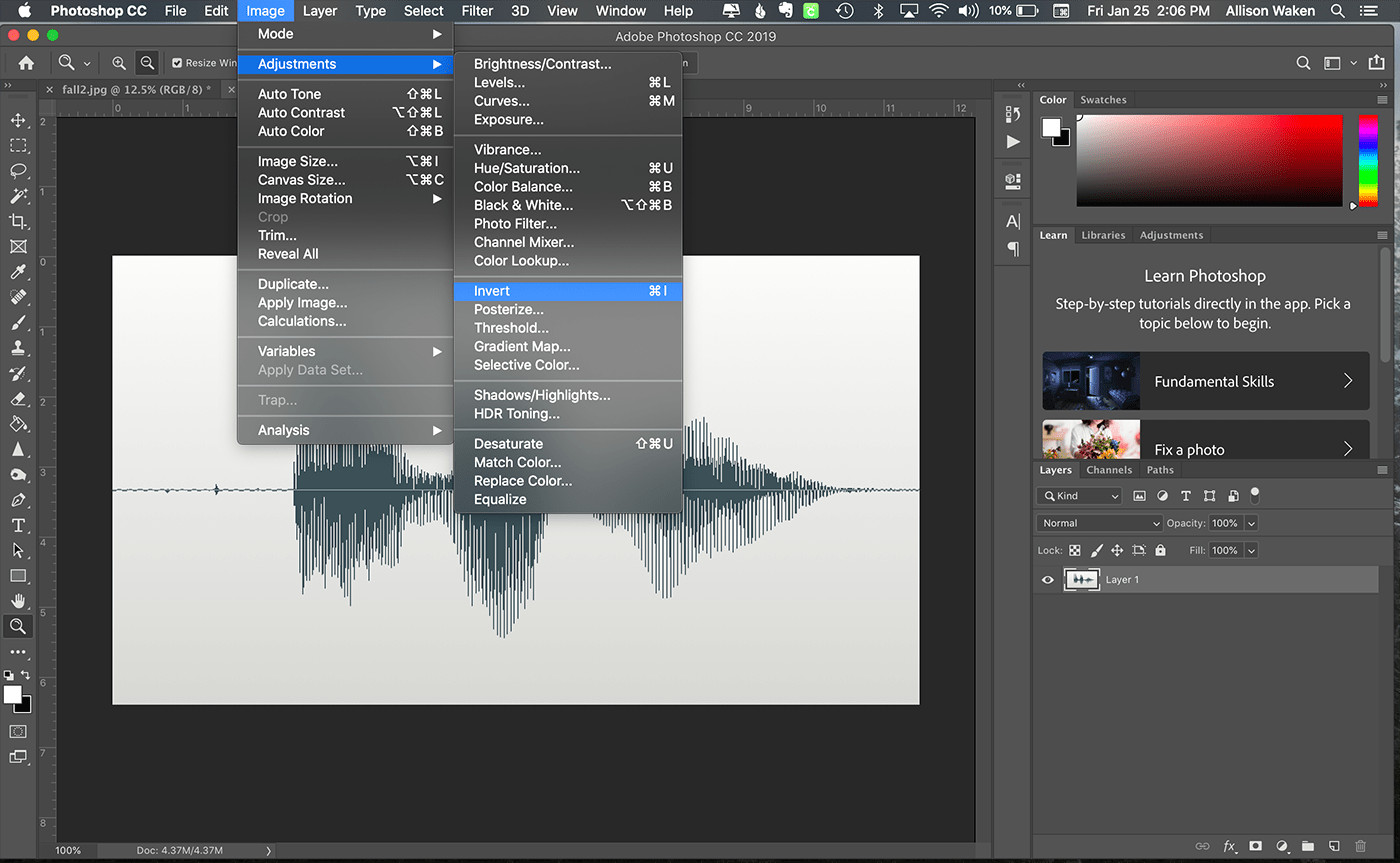
- Edit the Image (Optional): Use a photo editing program like Photoshop or GIMP to adjust the colors, contrast, or add annotations.
2.3. Advanced Techniques in Adobe Audition
For more advanced users, Adobe Audition offers a range of tools for detailed sound wave visualization:
- Open Audio File: Launch Adobe Audition and open your audio file by going to “File” > “Open”.
- View Waveform or Spectral Display: Audition allows you to view the audio as a waveform or a spectral display. Go to “View” > “Display Waveform” or “Display Spectral Frequency Display”.
- Customize the Display: Adjust the color scheme, resolution, and other display settings in the “Preferences” menu.
- Analyze Audio: Use the built-in analysis tools to measure frequency, amplitude, and other parameters.
- Capture and Export: Use the screenshot tool or export the audio as an image file by going to “File” > “Export” > “Audio to Image”.
2.4. Tips for Optimizing Sound Wave Images
- Choose the Right Software: Select software that matches your skill level and project requirements.
- Adjust Display Settings: Experiment with different display settings to find the most informative and visually appealing representation.
- Use High-Quality Audio: High-quality audio recordings produce more detailed and accurate sound wave images.
- Edit for Clarity: Use photo editing software to enhance the image and highlight important features.
3. Utilizing Online Tools and Apps for Sound Wave Visualization
Several online tools and mobile apps can quickly generate sound wave images without requiring extensive software installations.
3.1. Overview of Online Sound Wave Generators
Online sound wave generators are convenient for quick visualizations. Here are a few popular options:
- Waveformer: A simple online tool for creating sound wave images from audio files or microphone input.
- Spectrogram: Generates spectrograms from audio files, allowing you to visualize frequency content.
- Audio Cutter: Offers basic sound wave visualization along with audio editing tools.
- Online Tone Generator: Creates sine, square, and sawtooth waves, which can be visualized in real-time.
3.2. Mobile Apps for Sound Wave Images
Mobile apps provide a portable solution for sound wave visualization:
- WaveDraw: An iOS app that allows you to draw sound waves with your finger and play them back.
- Spectroid: An Android app for real-time audio spectrum analysis.
- Audio Spectrum Analyzer: Available for both iOS and Android, providing a detailed view of the audio spectrum.
3.3. How to Use an Online Sound Wave Generator
Using an online sound wave generator is typically straightforward:
- Visit the Website: Go to the website of your chosen online sound wave generator.
- Upload Audio: Upload your audio file or use the microphone to record new audio.
- Customize Settings: Adjust settings like color, resolution, and wave thickness.
- Generate Image: Click the “Generate” or “Create” button to produce the sound wave image.
- Download Image: Download the image to your computer or device.
3.4. Advantages and Disadvantages of Online Tools and Apps
Advantages:
- Convenience: No software installation required.
- Accessibility: Can be used on any device with a web browser or app store access.
- Ease of Use: Simple interfaces for quick visualizations.
Disadvantages:
- Limited Features: Fewer customization options compared to dedicated software.
- Internet Dependency: Requires an internet connection.
- Privacy Concerns: Uploading audio files to online services may raise privacy issues.
 Sound wave image created using an online sound wave generator
4. Creative Applications of Sound Wave Images
Sound wave images are used in various creative fields, from art and design to music and film.
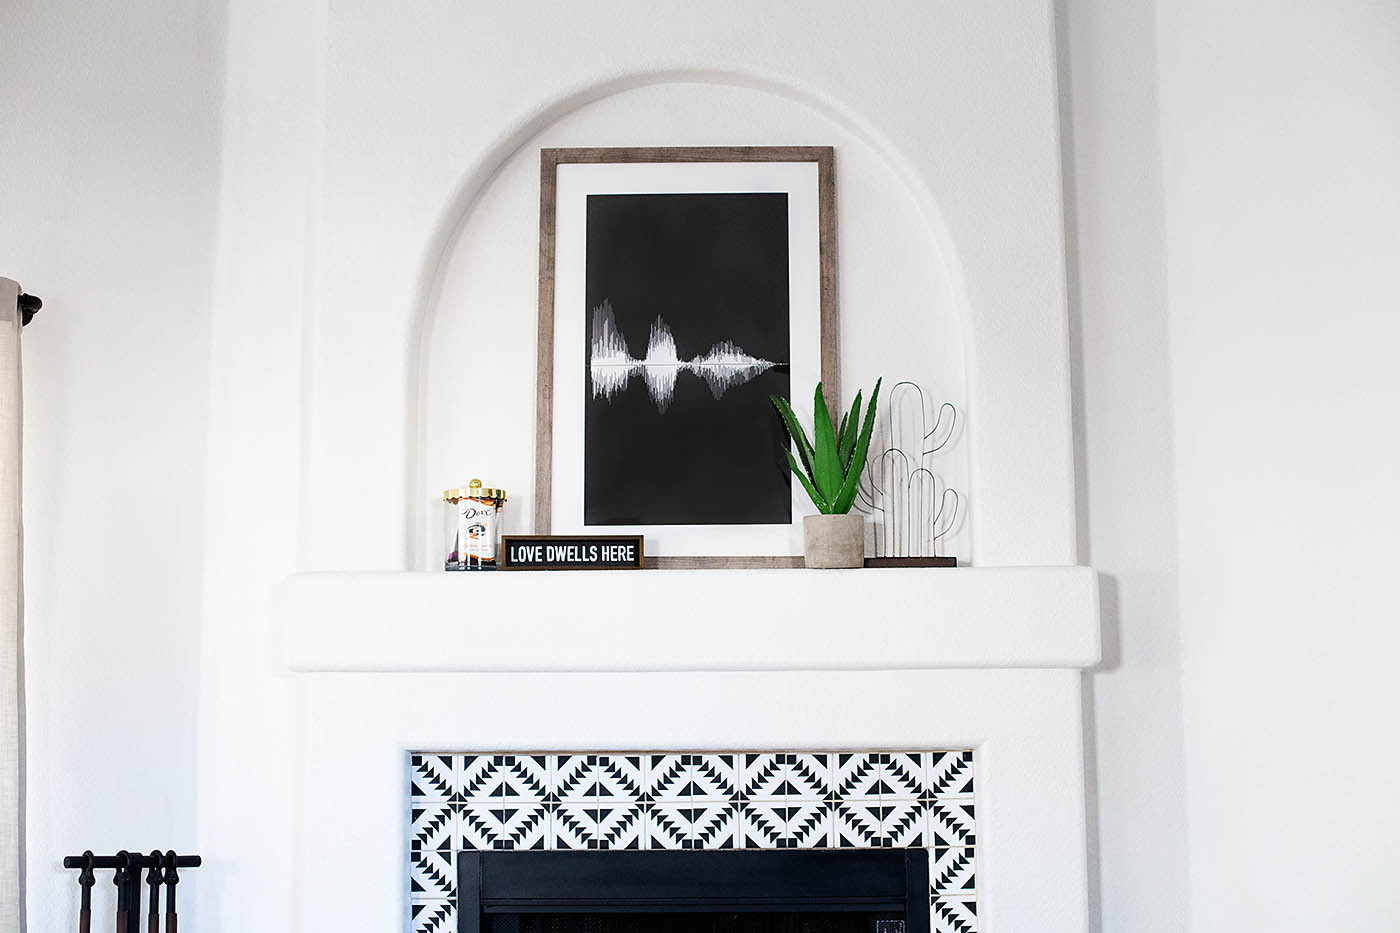
4.1. Sound Wave Art and Design
Sound wave art involves creating visual representations of sound for aesthetic purposes. Artists use sound wave images to produce striking and meaningful pieces.
- Wall Art: Printing sound wave images on canvas or paper for home or office decor.
- Jewelry: Engraving sound wave patterns on pendants, rings, or bracelets.
- Tattoos: Using sound wave designs for unique and personal tattoos.
- Sculptures: Creating 3D sculptures based on sound wave forms.
4.2. Music Visualization
Music visualization involves creating animated or static images that respond to music. Sound wave images play a crucial role in this field, providing a visual representation of the music’s dynamics.
- Music Videos: Incorporating sound wave visuals into music videos to enhance the viewing experience.
- Live Performances: Projecting sound wave images during live concerts to create an immersive environment.
- Audio Plugins: Using sound wave displays in audio plugins to provide visual feedback to users.
4.3. Sound Wave Images in Film and Video
In film and video production, sound wave images can add a layer of depth and sophistication to the visual narrative.
- Opening Titles: Using sound wave animations in opening titles to create a sense of anticipation.
- Sound Design: Visualizing sound effects and ambient sounds to better understand their impact.
- Educational Videos: Illustrating the principles of sound and acoustics using sound wave images.
4.4. Examples of Innovative Sound Wave Projects
- Resonance: An art installation that transforms sound into light patterns.
- The Sound of Color: A project that maps colors to different frequencies of sound.
- Visual Music: A series of experimental films that explore the relationship between sound and image.
5. Technical Aspects of Capturing and Processing Sound Waves
Capturing and processing sound waves involves understanding the technical details of audio recording and signal processing.
5.1. Microphones and Recording Equipment
The quality of your sound wave image depends on the quality of your audio recording. Choosing the right microphone and recording equipment is essential.
- Types of Microphones:
- Dynamic Microphones: Rugged and versatile, suitable for recording loud sounds.
- Condenser Microphones: More sensitive and accurate, ideal for studio recording.
- USB Microphones: Convenient for direct recording to a computer.
- Audio Interfaces: Devices that convert analog audio signals into digital signals for recording on a computer.
- Digital Audio Workstations (DAWs): Software for recording, editing, and mixing audio.
5.2. Sampling Rate and Bit Depth
Sampling rate and bit depth are crucial parameters that affect the quality of digital audio recordings.
- Sampling Rate: The number of samples taken per second, measured in Hertz (Hz). Higher sampling rates capture more high-frequency information. Common sampling rates include 44.1 kHz (CD quality) and 48 kHz (professional audio).
According to research from the Audio Engineering Society, a higher sampling rate improves audio fidelity. - Bit Depth: The number of bits used to represent each sample. Higher bit depths provide greater dynamic range and lower noise. Common bit depths include 16-bit (CD quality) and 24-bit (professional audio).
5.3. Signal Processing Techniques
Signal processing techniques can enhance the quality of sound wave images by cleaning up audio recordings and emphasizing important features.
- Noise Reduction: Removing unwanted noise from audio recordings.
- Equalization (EQ): Adjusting the frequency balance of audio to enhance certain frequencies or reduce others.
- Compression: Reducing the dynamic range of audio to make it sound louder and more consistent.
- Filtering: Removing specific frequencies from audio, such as low-frequency rumble or high-frequency hiss.
5.4. Common Issues and Solutions
- Clipping: Occurs when the audio signal exceeds the maximum level, resulting in distortion. Solution: Reduce the input gain or use a compressor.
- Noise: Unwanted sounds that interfere with the audio. Solution: Use noise reduction techniques or record in a quieter environment.
- Phase Issues: Problems with the timing relationship between different audio signals. Solution: Use phase correction tools or adjust microphone placement.
 Recording sound waves using professional audio equipment
6. Optimizing Sound Wave Images for Different Platforms
Different platforms have different requirements for image resolution, file format, and color space. Optimizing your sound wave images for each platform ensures they look their best.
6.1. Image Resolution and Size
- Web: For web use, images should be optimized for fast loading times. A resolution of 72 DPI (dots per inch) is typically sufficient.
- Print: For print use, images should have a higher resolution of 300 DPI to ensure sharpness and detail.
- Video: For video use, images should match the resolution of the video format (e.g., 1920×1080 for Full HD).
6.2. File Formats
- JPEG: A lossy compression format suitable for photographs and images with smooth gradients.
- PNG: A lossless compression format ideal for images with sharp lines, text, and transparency.
- GIF: A lossless compression format suitable for animated images and simple graphics.
- TIFF: A lossless format often used for high-quality print images.
6.3. Color Spaces
- RGB: The standard color space for web and digital displays.
- CMYK: The color space used for print.
- Grayscale: A color space that represents images using shades of gray.
6.4. Platform-Specific Guidelines
- Social Media: Each social media platform has its own recommended image sizes and formats. Refer to the platform’s guidelines for optimal results.
- Websites: Optimize images for web use by compressing them and using responsive image techniques.
- Print: Consult with your printer to determine the best image resolution, file format, and color space for your project.
7. Legal and Ethical Considerations
When working with sound wave images, it’s important to consider the legal and ethical implications of using copyrighted material.
7.1. Copyright and Intellectual Property
Copyright protects original works of authorship, including audio recordings and visual representations of sound. Unauthorized use of copyrighted material can result in legal penalties.
7.2. Fair Use
Fair use is a legal doctrine that allows limited use of copyrighted material without permission for purposes such as criticism, commentary, news reporting, teaching, scholarship, and research.
7.3. Creative Commons Licenses
Creative Commons licenses provide a flexible way for creators to grant certain rights to their work while retaining copyright. Different types of Creative Commons licenses specify different usage permissions.
7.4. Best Practices
- Obtain Permission: Always seek permission from the copyright holder before using copyrighted material.
- Give Credit: Properly attribute the source of any copyrighted material you use.
- Use Royalty-Free Content: Consider using royalty-free audio and images, which are available for use without paying royalties.
- Consult a Lawyer: If you have any doubts about the legality of using certain material, consult with a copyright lawyer.
8. The Future of Sound Wave Visualization
The field of sound wave visualization is constantly evolving, with new technologies and techniques emerging all the time.
8.1. Emerging Technologies
- Artificial Intelligence (AI): AI is being used to develop more sophisticated sound wave visualization tools that can automatically analyze and interpret audio data.
- Virtual Reality (VR) and Augmented Reality (AR): VR and AR technologies are creating immersive experiences that combine sound and visuals in new ways.
- Interactive Sound Wave Visualizations: Interactive visualizations allow users to manipulate sound waves in real-time and explore their properties.
8.2. Trends in Sound Wave Art and Design
- Generative Art: Using algorithms to create unique and dynamic sound wave art.
- Data Visualization: Combining sound wave data with other data sources to create informative and engaging visualizations.
- Personalized Sound Experiences: Creating customized sound wave visualizations based on individual preferences and experiences.
8.3. Potential Applications
- Medical Diagnostics: Using sound wave visualizations to detect and diagnose medical conditions.
- Environmental Monitoring: Analyzing soundscapes to monitor noise pollution and identify environmental changes.
- Security: Using sound wave analysis to detect and prevent security threats.
8.4. Resources for Staying Updated
- Acoustical Society of America (ASA): A professional organization for acousticians and researchers.
- Audio Engineering Society (AES): A professional organization for audio engineers and scientists.
- Online Forums and Communities: Engaging with online forums and communities dedicated to sound and audio.
9. Real-World Examples and Case Studies
Exploring how sound wave images are used in practical scenarios provides valuable insights and inspiration.
9.1. Case Study 1: Sound Wave Art for a Music Festival
A music festival commissioned an artist to create a large-scale sound wave art installation. The artist recorded sounds from the festival grounds, including music, crowd noise, and ambient sounds. They then used audio editing software to generate sound wave images and combined these images into a visually stunning display that was projected onto the main stage during performances.
9.2. Case Study 2: Music Visualization for a Live Concert
A band incorporated real-time music visualization into their live concerts. They used software that analyzed the music in real-time and generated dynamic sound wave images that were projected onto a screen behind the band. The visualizations enhanced the audience’s experience and created a more immersive and engaging performance.
9.3. Case Study 3: Sound Wave Analysis for Noise Pollution Monitoring
An environmental agency used sound wave analysis to monitor noise pollution in a city. They deployed microphones at various locations throughout the city and recorded ambient sounds. They then used software to generate spectrograms and identify sources of noise pollution, such as traffic, construction, and industrial activity. The data was used to develop strategies for reducing noise pollution and improving the quality of life for residents.
9.4. Case Study 4: Sound Wave Visualization in a Medical Application
Researchers developed a medical device that uses sound wave visualization to detect and diagnose heart conditions. The device records heart sounds and generates sound wave images that can be analyzed by doctors. The visualizations help doctors identify abnormalities in heart sounds and diagnose conditions such as heart valve disease and heart failure.
10. Frequently Asked Questions (FAQs)
10.1. What is a sound wave image?
A sound wave image is a visual representation of an audio signal, typically displaying amplitude over time.
10.2. How can I create a sound wave image?
You can create a sound wave image using audio editing software, online tools, or mobile apps.
10.3. What software is best for creating sound wave images?
Popular options include Audacity, Adobe Audition, and WavePad.
10.4. Can I use online tools to generate sound wave images?
Yes, several online tools, such as Waveformer and Spectrogram, can generate sound wave images.
10.5. What are the common uses of sound wave images?
Sound wave images are used in art, music visualization, film, education, and scientific analysis.
10.6. How do I optimize sound wave images for different platforms?
Optimize images by adjusting the resolution, file format, and color space for each platform.
10.7. Are there any legal considerations when using sound wave images?
Yes, be aware of copyright and intellectual property rights, and ensure you have permission to use any copyrighted material.
10.8. What is the future of sound wave visualization?
The future includes advancements in AI, VR, AR, and interactive visualizations.
10.9. How does streetsounds.net contribute to sound wave visualization?
Streetsounds.net provides a platform for exploring and sharing soundscapes, offering resources and inspiration for sound wave visualization projects.
10.10. Where can I find royalty-free audio for creating sound wave images?
You can find royalty-free audio on websites like PremiumBeat, Epidemic Sound, and the Free Music Archive.
At streetsounds.net, we are dedicated to providing you with the tools and knowledge you need to explore the world of sound. Whether you are a seasoned professional or a curious beginner, we invite you to dive into our extensive library of soundscapes and discover the endless possibilities of sound wave visualization.
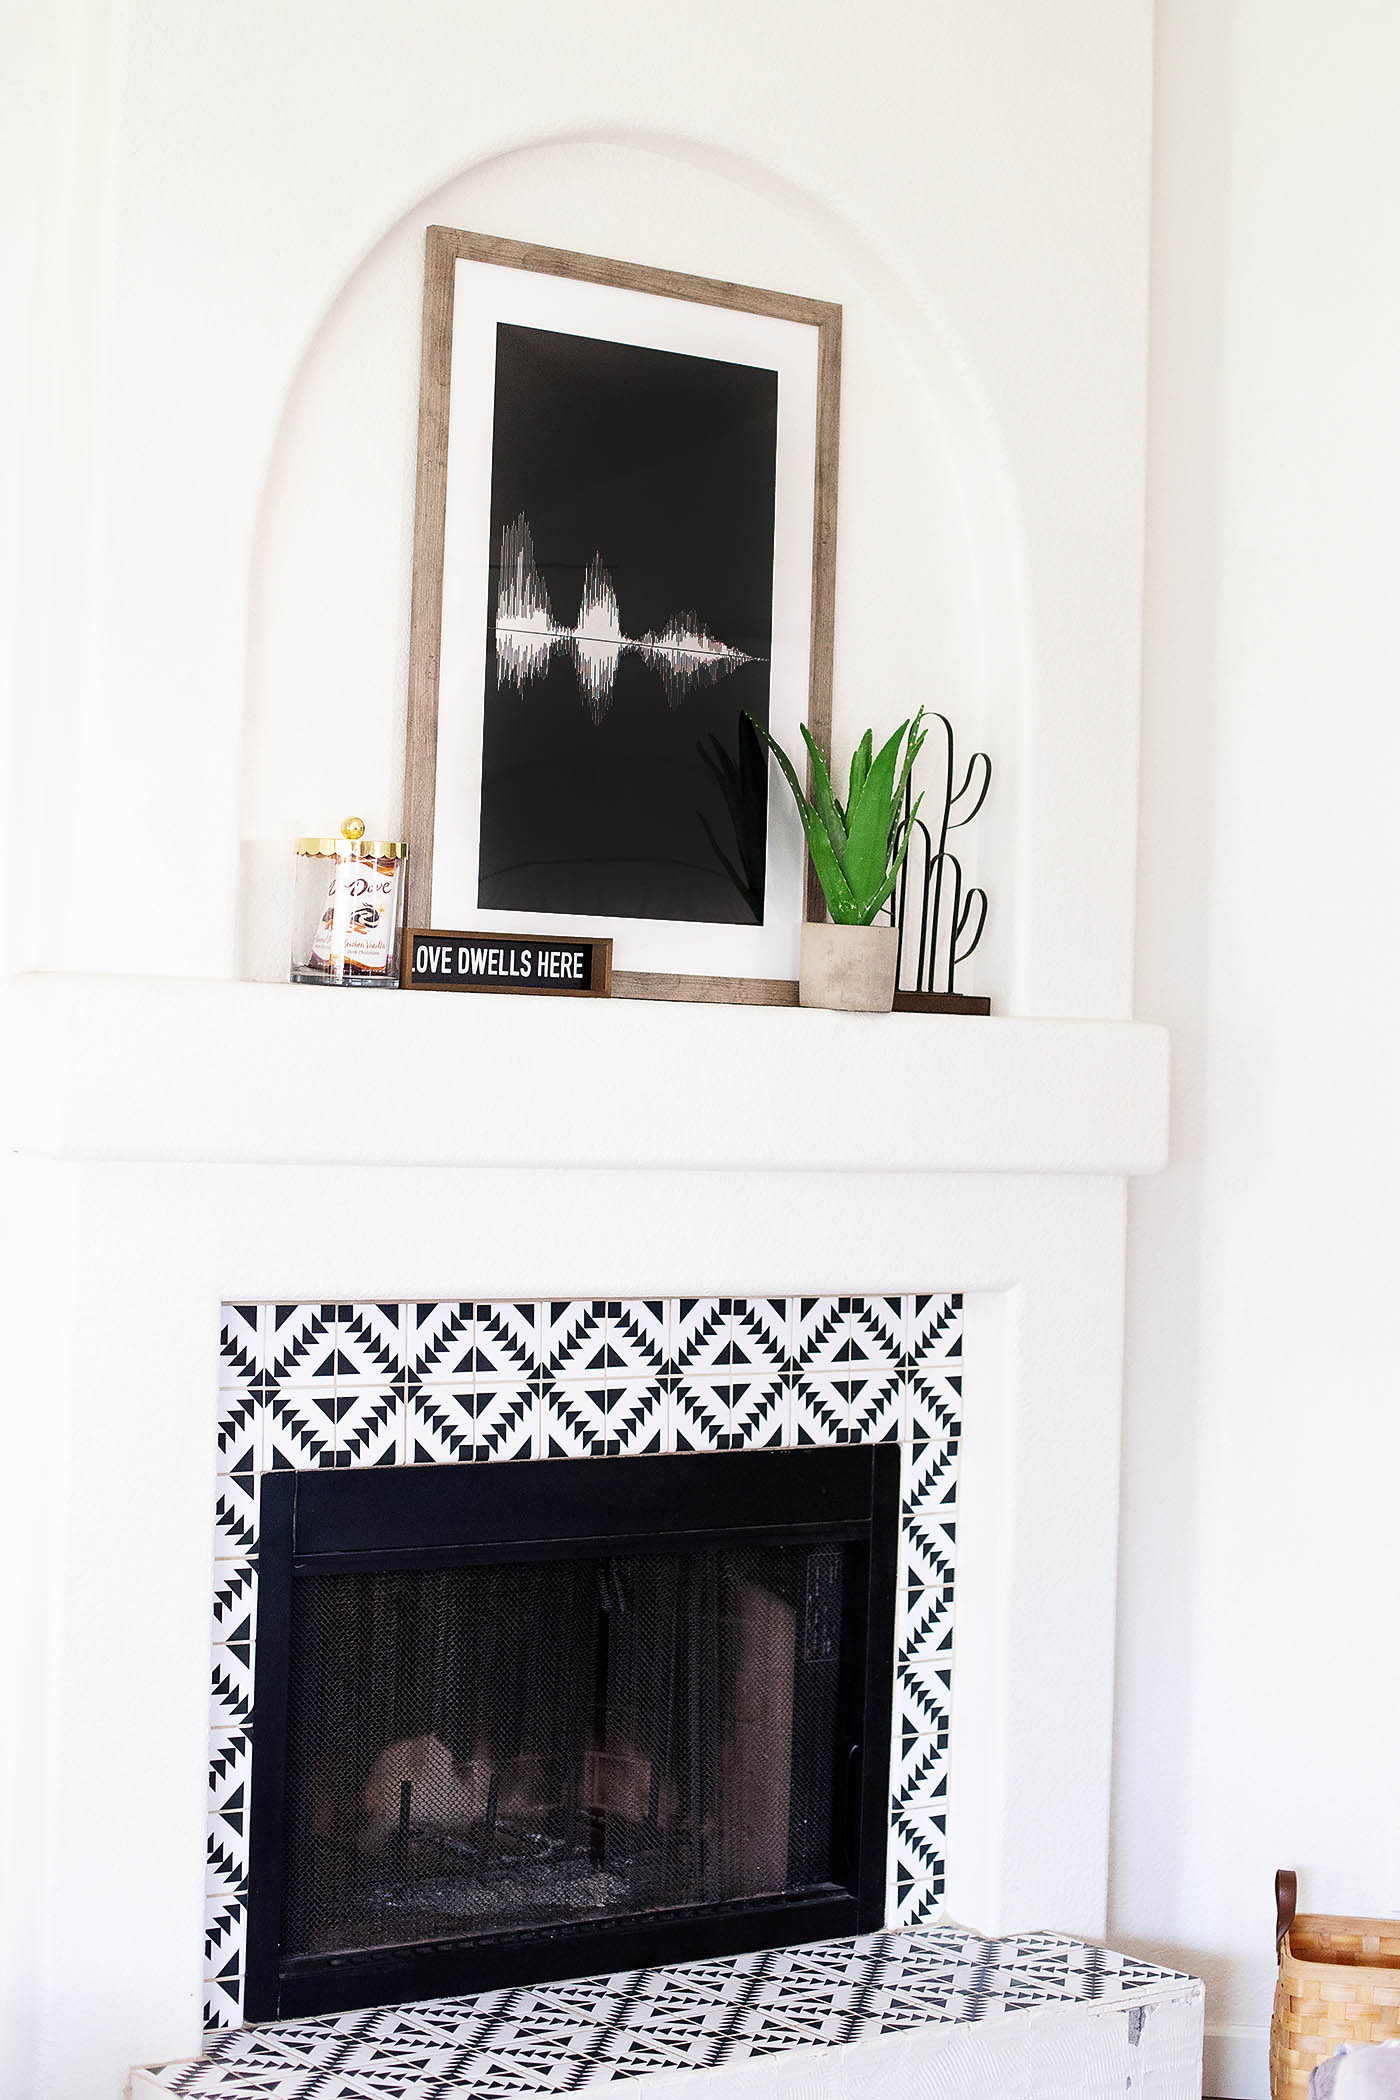 Framed sound wave art piece
Ready to transform your audio into stunning visuals? Visit streetsounds.net today to explore our library of high-quality sound effects and discover inspiring articles and tutorials. Join our community of sound enthusiasts and start creating your own sound wave masterpieces! Contact us at 726 Broadway, New York, NY 10003, United States, or call +1 (212) 998-8550. Let’s create something amazing together!
